Mish's Global Economic Trend Analysis
Mish's Global Economic Trend Analysis

Posted: 01 Jul 2012 09:07 PM PDT
The global economy led by Europe and China continues its downward path. Will the US follow?
First let's take a look at China. Markit reports China Manufacturing PMI Declines 8th Consecutive Month.
Key pointsChina PMI vs. Shanghai Stock Index
- New orders fall to greatest extent in seven months, as export orders slump
- Factory output declines marginally in comparison; stocks of finished goods rise
- Input costs and output charges down at sharpest rates in 39- and 42-months respectively
China's goods producers reported an eighth successive month-on-month deterioration in operating conditions during June, as output, incoming new orders and employment continued to decrease. After adjusting for seasonal factors, the HSBC Purchasing Managers' Index™ (PMI™) – a composite indicator designed to give a single-figure snapshot of operating conditions in the manufacturing economy – inched lower from 48.4 to 48.2 in June, a level indicative of a modest pace of deterioration in business conditions. For the second quarter as a whole, the index averaged its lowest quarterly value since Q1 2009.
A lack of demand was behind the latest deterioration in operating conditions, with total and foreign new orders falling at accelerated rates in June. New export orders placed at goods producers dropped at the steepest rate in over three years. North America and Europe were both cited as sources of new order book weakness. Meanwhile, the month-on-month fall in overall new orders (exports plus domestic) was the strongest in 2012 to date. The drop in total new orders led to a further decline in manufacturing output, extending the current period of contraction to four months. However, the rate of decline in factory output remained marginal.
Comment
Commenting on the China Manufacturing PMI™ survey, Hongbin Qu, Chief Economist, China & Co-Head of Asian Economic Research at HSBC said: "It is all about growth and employment. As external demand has weakened and domestic demand hasn't shown a meaningful improvement in response to earlier easing measures, growth is likely to be on track for further slowdown, hence weighing on the jobs market. But as inflation eases sharply, Beijing has plenty of room and policy ammunition to avoid a hard landing. We expect more decisive easing efforts to come through in the coming months."
The following charts show an interesting story of unsustainable growth and over-exuberance by China cheerleaders nearly everywhere.
China PMI
$SSEC Shanghai Stock Index
Decoupling Review
Notice the bubble in 2007. That's when all sorts of ridiculous decoupling theories, US hyperinflation scenarios, US treasury crash scenarios, crude is going to $200, Natural Gas is going to $40, and other nonsensical ideas came out of the woodwork, many in book form, some still persisting to this day.
Instead, the reverse happened! It was the US that decoupled from the global economy. Moreover, China has been exposed for the malinvestment bubble that it is.
Now, in 2012, nearly everyone but the die-hard hyperinflationists thinks the US will decouple from the global economy. This reverse-decoupling idea is primarily based on the absurd belief the Fed will not let the economy or the stock market down (when the Fed is in fact not in control). For further discussion, please see Is There a Limit on Central Bank's Ability to Inflate?
The debate on the Fed will remain, but the facts show that I disagreed with decoupling in 2007 and I disagree with reverse-decoupling theories now.
Please see 12 Reasons US Recession Has Arrived (Or Will Shortly) for detailed rationale.
Mike "Mish" Shedlock
http://globaleconomicanalysis.blogspot.com
Click Here To Scroll Thru My Recent Post ListMike "Mish" Shedlock is a registered investment advisor representative for SitkaPacific Capital Management. Sitka Pacific is an asset management firm whose goal is strong performance and low volatility, regardless of market direction. Visit http://www.sitkapacific.com/account_management.html to learn more about wealth management and capital preservation strategies of Sitka Pacific.
Email From Lead Analyst at EIA on Petroleum Usage
Posted: 01 Jul 2012 11:27 AM PDT
In response to my post 3-Month Petroleum Usage Chart for March, April, May Shows 14 Years of Supply Demand Growth has Vanished (with charts from Tim Wallace) I received a nice email from James Beck, Lead Analyst, Weekly Petroleum Status Report Team, Energy Information Administration (EIA).
Hello Mike and TimJet Fuel and Propane
I just wanted to chime in on your latest charts. As the Lead Analyst for the Weekly Petroleum Status Report at the Energy Information Administration, I appreciate that you use our numbers.
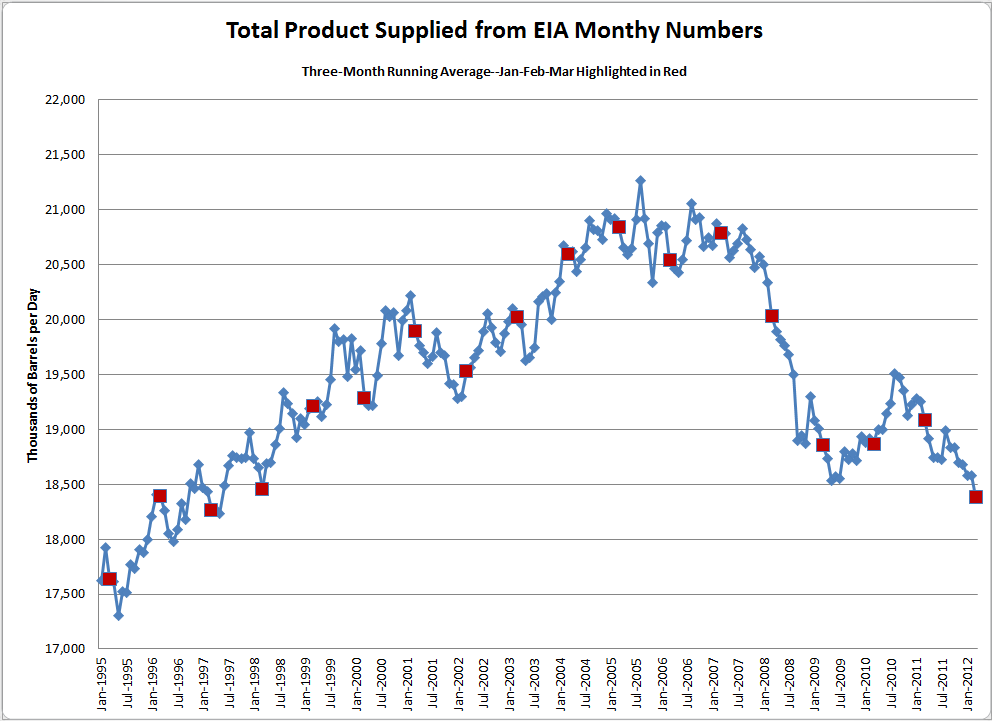
While I do appreciate the use of the weekly numbers, I wanted to send you these three charts (with all of their data included) based on the EIA's Petroleum Supply Monthly which supports your point that demand for gasoline is at 2002 levels and that total petroleum product demand is at 1997/98 levels.
Additionally, I have included the distillate demand chart which shows that since the recession began in 2008, we have had distillate demand at 2000-2002 levels, and 2012 has the second-weakest Jan-Mar level since 2002 (2012 is 0.3% higher than the Jan-Mar demand for 2010, which was the lowest since 2000).
Since diesel demand is a very good proxy for the health of the economy (all shipping uses diesel--trucking, rail, barge, etc.), this weakening might be an indication of things to come.
The reason to look at the monthly numbers is that they are more reliable than the weekly as the survey is of the entire industry and there is a great deal of extra time used to verify the data. Many people believe that the monthly numbers are a revision of the weekly numbers. This is not true. These are separate surveys. Where the monthly surveys the entire industry and collects much more detailed information, the weekly information is based on a sample of the industry drawn from the monthly reporters, collects less information, and is focused on timeliness versus completeness.
The weekly numbers are estimates of the most recent week's data based on the sample and are a snapshot in time. The weekly is a very good indicator of the data, but the monthly is the touchstone (at least until the Petroleum Supply Annual is released--which is, in fact, a revision of the monthly data).
I hope you can make use of the charts. Please let me know if I can be of further assistance.
Thank you,
James Beck
Lead Analyst,
Weekly Petroleum Supply Team
Energy Information Administration Office of Petroleum and Biofuels Statistics
In a follow-up email I asked about jet fuel and received this response.
Hello MishMonthly Delays
Seems KJet is at lowest Jan-Mar level since 1992. KJet suffered post 9/11 then with high fuel costs in 2006-2008. There has been a watershed change in how airlines operate because of the fuel cost (higher occupancy; fewer routes; different business processes for taxiing, at-gate operations, for efficient jets, etc.). Even when passenger miles recovered to pre-9/11 levels, the demand for kjet remained much lower.
Propane is highly seasonal, but even there the Jan-Mar level is lowest since 1995.
James Beck
The reason Tim Wallace uses weekly data is one of timeliness. There are long delays in waiting for monthly stats. It is nice to see that the monthly charts below confirm what Tim Wallace has been saying.
Here are the monthly charts from James Beck.
Because of seasonal variations, the proper comparison in each of the charts below is red-dot to red-dot.
Total Petroleum Usage
Diesel and Heating Oil
Gasoline
Jet Fuel
Propane
Thanks James and Tim!
Mike "Mish" Shedlock
http://globaleconomicanalysis.blogspot.com
Click Here To Scroll Thru My Recent Post ListMike "Mish" Shedlock is a registered investment advisor representative for SitkaPacific Capital Management. Sitka Pacific is an asset management firm whose goal is strong performance and low volatility, regardless of market direction. Visit http://www.sitkapacific.com/account_management.html to learn more about wealth management and capital preservation strategies of Sitka Pacific.
Monday, 2 July 2012
Mish's Global Economic Trend Analysis


Subscribe to:
Post Comments (Atom)
No comments:
Post a Comment